Facebook Ads Auditor
In the following notebook, it is explored methodologies and limitations of using the Facebook Graph API to access the Facebook Ads library performing data analysis from an auditing viewpoint on the Dutch credit housing market getting key insights of advertisement practices.

The notebook is divided in 3 main sections:
- 1. Facebook Ads Library
- 2. Accessing the Facebook API as Developer
- 3. Discovering Key Insights Analysing Ads Data
The first section discusses how to use and access Facebook ads data introducing the Facebook Ads Library service. The second section shows how to connect directly to the Graph API in developer mode and gather advertisement data directly, and thus perform data analysis for auditing. Finally, the third section presents an auditing data analysis exploring some key insights that could be useful for Consumer Protection Investigations
Key Insights Summary
In this data auditing, advertisement data has been automatically collected on 500 ads using Facebook's Ad Library API. It is been searched the API by all advertisers and all active and innactive ads available. We have observed that the average time of ads impressions is 8 days to the consumers, particularly, the 45+ were the most microtargeted group with ads impressions for more than a week in most cases. Interestingly, there were certain ads that microtargeted very specific groups reaching a huge audience (more than a 1M impressions) in a short amount of time (less than a day), these came from CDA-jongeren, the International Literature Festival, and ASN Bank, targeting 18-24 male, 65+ female and 18-24 female respectively. Surprisingly, the ad related to the festival contains the keywords and together with the ASN ads are tagged as Issues, Elections or Politics which is odd but probably strategic. ASN Bank campaign also shows to be the longest one, this is interesting since there is no other bank are showing in the data. Furthermore, it is been audited the authenticity of links and the behaviour of campaigns and there is no indication of scammers in this data. The most microtargeted region was Paramaribo, with one campaign that was shown only there. But also we see cases where the demographics are not specified, therefore, groups of 13-17 are exposed. In conclusion, the fact that Facebook only allows accessing ads tagged as Issues, Elections or Politics creates a big limitation to audit, Because even though we can perform queries related to the house market we are only getting the tagged ones and we don't know how much are we missing.
Data acquisition and analysis were done using the Python programming language. Plotly for visualization and word frequencies by using the Natural Language Toolkit. The ads data and code used for the analysis can be found in the Github repo of this work. Any comments, please contact us at p.hernandezserrano@maastrichtuniversity.nl
1. Facebook Ads Library
The Facebook Ads Library is an open repository of all the ads and campaigns, active and inactive from many countries that Facebook runs. This repository is exposed as a service with a search engine interface that will help users to easily look up for ads, campaigns, Facebook pages, etc. in the Facebook ads database, this service can be accessed by using the Facebook Graph API. The search interface has two filters Country and Ad Type.
Limitations:
- The service is limited for the user to select one country at a time
The service only allows to look up
All adsat once or theIssues, Elections or Politicscategory.Unfortunately Facebook is not making public the rest of their defined categories, this should be followed up by data-related regulation conversations.
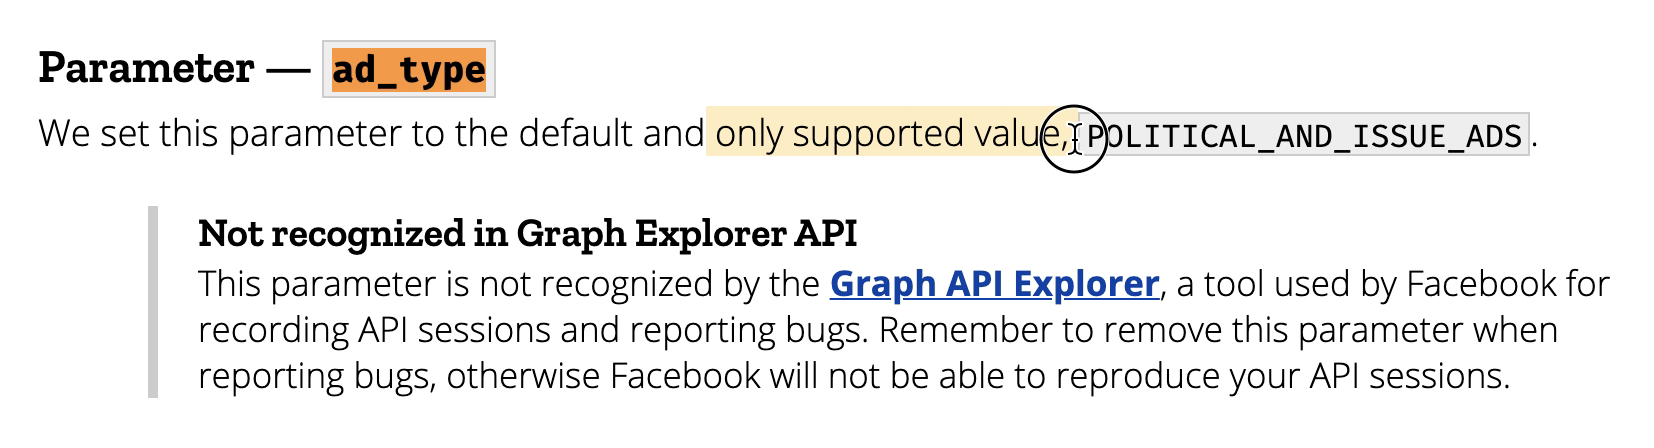
The service shows the details of each ad, but actually only show the ad identifier, the link to the page, and the ad content, only the
Issues, Elections or Politicsads contain information about the demographics of the audiences, the rest of the ads do NOT contain demographicsUsing the API is impossible to do the last query since Facebook is only making public the parameter
POLITICAL_AND_ISSUE_ADStherefore the rest of the ads are not accessible via the API
The following EU technical in ads transparency report documents the use of Facebook Graph API and how was used for analysing general elections ads https://adtransparency.mozilla.org/eu/methods/
Approach:
The following auditing of ads will access all the ads tagged as POLITICAL_AND_ISSUE_ADS given that is the only option. In the following analysis, we perform a query on Hypotheek related topics getting a number of ads, however, we won't get the Hypotheek related ads that are not tagged as POLITICAL_AND_ISSUE_ADS and we will never know how many are we missing (only Facebook knows).
2. Accessing the Facebook API as Developer
The Facebook Graph API is the primary way for apps to read and write to the Facebook social graph. The official documentation is found in APIs and SDKs docs here. The Graph API has many uses, from creating and publish a game to analyze friends networks, naturally contains the Ads that Facebook publishes but only a limited amount of those, only limited to social issues and politics. In order to access and use the API, you need to gain access to the Facebook Ads Library API at https://www.facebook.com/ID and confirm your identity for running (or analysing) Ads About Social Issues, Elections or Politics, which involves receiving a letter with a code at your official account and sending picture identification to Facebook. Basically one has to be registered as an official Facebook developer, and this permission can actually take from one day to weeks.
The Facebook API has also a nice user interface (for developers) called the Graph API Explorer, which allows the developer or analyst to quickly generate access tokens, get code samples of the queries to run, or generate debug information to include in support requests. Here more info.
Requirements
- Register as a developer at developers.facebook.com
- Go to Graph API explorer and create an app
- Having a new app ID. Create a Token for the new app in the UI
- Define the Graph API Node to use:
ads_archive
An example query that can be retrieved from the Graph API Explorer is the following
        ads_archive?access_token=[TOKEN]
        &ad_type=POLITICAL_AND_ISSUE_ADS
        &ad_active_status=ALL
        &fields=ad_creation_time%2Cad_creative_body2Cpage_name%2Cdemographic_distribution
        &limit=100
        &ad_reached_countries=NL
        &search_terms=.
There are of course a number of clients that can perform API calls, in the following pilot data analysis we are using a Python implementation
Interface example:

3. Auditing Facebok Ads
The following section is divided into Data Collection and Descriptive Statistics in order to understand better the data, finally, we are going to briefly discuss the insights.
Auditing Facebok Ads - Data Collection
Max Woolf's facebook-ad-library-scraper it's the best out-the-box solution (as of mid 2021) to to retrive ads data from a Python client, since it requires minimal dependencies.
Usage
- Configure the script via
config.yaml. Go to https://developers.facebook.com/tools/explorer/ to get a User Access Token, and fill it in with your token (it normally expires after a few hours but you can extend it to a 2-month token via the Access Token Debugger). Change other parameters as necessary. - Generate a token clicking the button "Generate Access Token" and copy it, then paste t in the TOKEN.txt file in the root of this folder
- Install the requirements by running the following:
!pip3 install requests tqdm plotly - Run the scraper script:
!python fb_ad_lib_scraper.py
- Outputs: This script outputs three CSV files in an ideal format to be analyzed.
fb_ads.csv: The raw ads and their metadata.
fb_ads_demos.csv: The unnested demographic distributions of people reached by ads, which can be mapped to fb_ads.csv via the ad_id field.
fb_ads_regions.csv: The unnested region distributions of people reached by ads, which can be mapped to fb_ads.csv via the ad_id field.
The following notebook automatically extracts over 500 ads by querying keywords related to housing credit: 'hypotheek', 'hypotheekadvies', 'huizen te koop', 'huis kopen' filtering therefore the ones related to the housing credit and setting a manageable limit for the API.
The data: The fields include all details about the ads, like creation time, link, description, and caption. Moreover, each ad is associated with a funding entity and a source page, this source page is normally the marketer or the original Facebook page associated with the ad, finally, there is information on the amount spend, and demographics like gender and regions.
  Age groups:
    - 18-24
    - 25-34
    - 35-44
    - 45-54
    - 55-64
    - 65+

  Gender groups:
    - male
    - female
    - unknown

  Regions:
    - Noord-Holland
    - Zuid-Holland
    - Gelderland
    - North Brabant
    - Utrecht
    - Groningen
    - Overijssel
    - Flevoland
    - Limburg
    - Friesland
    - Zeeland
Extracting and reading the data
# hypotheek
!python fb_ad_lib_scraper.py
4%|█▋ | 204/5000 [00:02<01:01, 78.16it/s]
# hypotheekadvies
!python fb_ad_lib_scraper.py
0%| | 2/5000 [00:00<22:14, 3.75it/s]
# huizen te koop
!python fb_ad_lib_scraper.py
0%| | 11/5000 [00:00<05:49, 14.27it/s]
# huis kopen
!python fb_ad_lib_scraper.py
2%|▉ | 117/5000 [00:02<01:24, 57.72it/s]
# geld lenen
!python fb_ad_lib_scraper.py
1%|▌ | 68/5000 [00:01<01:40, 48.88it/s]
# Lening
!python fb_ad_lib_scraper.py
2%|▊ | 105/5000 [00:02<01:58, 41.22it/s]
files = !ls ./data
import pandas as pd
df_ads = pd.DataFrame()
for i in [6,7,8,9,10,11]:
    df_ads = df_ads.append(pd.read_csv('data/'+files[i]),ignore_index=True)
#print(len(df_ads['ad_id'].unique()))

df_demographics = pd.DataFrame()
for i in [0,1,2,3,4,5]:
    df_demographics = df_demographics.append(pd.read_csv('data/'+files[i]),ignore_index=True)
#print(len(df_demographics['ad_id'].unique()))

df_regions = pd.DataFrame()
for i in [12,13,14,15,16,17]:
    df_regions = df_regions.append(pd.read_csv('data/'+files[i]),ignore_index=True)
#print(len(df_regions['ad_id'].unique()))
Auditing Facebok Ads - Descriptive Statistics
The following section is focused on the statistical methodologies ffor auditing Facebook Ads data, it is important to note that no hypothesis testing is performed in the current pilot data analysis, meaning that no correlation analysis or causal effects are studied. The purpose of this section is to understand the key insights of the data and therefore ask questions about ads practices.
Ads Impressions Period
The ads run following the configuration set up that was made by the campaign creator, normally the conditions are that the campaign will run until the funds are exhausted, and there is a declared min and max per ad. Following this logic, some ads can run for hours, but some others for days, here we find the average, max, min and count of each ad
# Number of unique ads
len(df_ads.ad_id.unique())
392
# Converting to datetime
df_ads[['ad_delivery_start_time', 'ad_delivery_stop_time']] =\
    df_ads[['ad_delivery_start_time', 'ad_delivery_stop_time']]\
    .apply(pd.to_datetime)
# Ads delivery period
df_ads['ad_delivery_start_time'].describe(datetime_is_numeric=True)
count                              507
mean     2021-01-07 05:52:11.360946688
min                2019-04-15 00:00:00
25%                2020-11-16 12:00:00
50%                2021-03-15 00:00:00
75%                2021-03-29 00:00:00
max                2021-09-08 00:00:00
Name: ad_delivery_start_time, dtype: object
The period of the dataset that was extracted from the API is 2019-04, to 2021-09. It is taken this period of time, since one can't specify the period in the API call, it seems this is all the information available.
# Creating a new feature, ads time: how long the ads were displayed in days
df_ads['ads_time'] = df_ads['ad_delivery_stop_time'] - df_ads['ad_delivery_start_time']
# Treat them as integer is useful also
df_ads['ads_days_time'] = pd.to_numeric(df_ads['ads_time'].dt.days, downcast='integer')

# Ads general stats
df_ads['ads_time'].describe()
count                           501
mean      8 days 15:16:53.173652694
std      15 days 00:25:53.601970303
min                 0 days 00:00:00
25%                 1 days 00:00:00
50%                 3 days 00:00:00
75%                 7 days 00:00:00
max                69 days 00:00:00
Name: ads_time, dtype: object
The campaigns are online in average 8 days and 15 hours, with a standard deviation of 15 days, the max campaign duration is 69 days.
df_ads.sort_values(by='ads_time',ascending=False).head(5)
| ad_id | page_id | page_name | ad_creative_body | ad_creative_link_caption | ad_creative_link_description | ad_creative_link_title | ad_delivery_start_time | ad_delivery_stop_time | demographic_distribution | funding_entity | impressions_min | spend_min | spend_max | ad_url | currency | ads_time | ads_days_time | |
|---|---|---|---|---|---|---|---|---|---|---|---|---|---|---|---|---|---|---|
| 359 | 752867881939190 | 133687759997528 | ASN Bank | Ontdek de voordelen van de ASN Hypotheek:\n✅ H... | fb.me | Gratis oriënterend gesprek | 2020-10-12 | 2020-12-20 | [{'percentage': '0.00028', 'age': '18-24', 'ge... | ASN Bank | 50000 | 1500 | 1999 | https://www.facebook.com/ads/library/?id=75286... | EUR | 69 days | 69.0 | |
| 358 | 668530274054090 | 133687759997528 | ASN Bank | Ontdek de voordelen van de ASN Hypotheek:\n✅ H... | fb.me | Gratis oriënterend gesprek | 2020-10-12 | 2020-12-20 | [{'percentage': '0.001883', 'age': '45-54', 'g... | ASN Bank | 1000 | 0 | 99 | https://www.facebook.com/ads/library/?id=66853... | EUR | 69 days | 69.0 | |
| 364 | 3668237753221254 | 133687759997528 | ASN Bank | Benieuwd wat verduurzamen van je nieuwe huis j... | fb.me | Gratis oriënterend gesprek | 2020-10-12 | 2020-12-20 | [{'percentage': '0.000165', 'age': '18-24', 'g... | ASN Bank | 80000 | 2000 | 2499 | https://www.facebook.com/ads/library/?id=36682... | EUR | 69 days | 69.0 | |
| 363 | 383663489335907 | 133687759997528 | ASN Bank | Benieuwd wat verduurzamen van je nieuwe huis j... | fb.me | Gratis oriënterend gesprek | 2020-10-12 | 2020-12-20 | [{'percentage': '0.002152', 'age': '45-54', 'g... | ASN Bank | 7000 | 100 | 199 | https://www.facebook.com/ads/library/?id=38366... | EUR | 69 days | 69.0 | |
| 362 | 1263725567359749 | 133687759997528 | ASN Bank | Benieuwd wat verduurzamen van je nieuwe huis j... | fb.me | Gratis oriënterend gesprek | 2020-10-12 | 2020-12-20 | [{'percentage': '0.001078', 'age': '65+', 'gen... | ASN Bank | 6000 | 200 | 299 | https://www.facebook.com/ads/library/?id=12637... | EUR | 69 days | 69.0 |
The longest campaign was the following ad from the ASN Bank. This ad was online for 69 days.

Here the actual URL to the archive:
https://www.facebook.com/ads/library/?active_status=all&ad_type=political_and_issue_ads&country=NL&q=752867881939190&sort_data[direction]=desc&sort_data[mode]=relevancy_monthly_grouped&search_type=keyword_unordered&media_type=all
Checking authenticity of links to find potential scammers
As we could see, the ads would normally link you to the seller page. However, some mischievous advertisers and marketers sometimes would use the ads to promote certain links or websites, this website would link to a scam page or sometimes viruses. One way to check the authenticity of the links is to actually compare the link URL to the name of the original page. Following this approach if the page name is ASN Bank then the associated link is asnbank.nl or similar. Obviously, there would be a number of false positives, nevertheless is a good indication of dubious links.
It is used the Levenshtein distance to measure the similarity between the link and the page name, the closer to 0 the similar the names.
import Levenshtein as lev
# Get the page name and the link to compare the authenticity
df = df_ads[['ad_creative_link_caption','page_name']].dropna()
df = df[df.ad_creative_link_caption.str.contains(".")]
distances = []
for index, row in df.iterrows():
    distances.append((row['page_name'], row['ad_creative_link_caption'], lev.distance(row['page_name'], row['ad_creative_link_caption'])))

# The closer the distance the more alike the link is to the advertiser name
df_distances = \
    pd.DataFrame(distances)\
    .rename(columns={0:'page_name',1:'link',2:'levenshtein_distance'})\
    .drop_duplicates(subset=['link'], keep='first')\
    .sort_values('levenshtein_distance',ascending=True)\
    .reset_index(drop=True)
df_distances.tail(10)
| page_name | link | levenshtein_distance | |
|---|---|---|---|
| 47 | WOMEN Inc. | www.werkurenberekenaar.nl | 23 |
| 48 | Jesse Klaver | groenlinks.nl/overheidssteun | 23 |
| 49 | Cuffer | https://cuffer.nl/products/kopen | 27 |
| 50 | Pieter Paul Slikker - PvdA 073 | dtvnieuws.nl | 27 |
| 51 | Beveiligde lening binnen 24 uur | fb.com | 30 |
| 52 | Democratisch Platform Enschede - DPE | tubantia.nl | 32 |
| 53 | Maurice Jonkers - Schrijver en man van het podium | mauricejonkers.com | 34 |
| 54 | PvdA Groningen | De toekomst van Grunn: Van wie is de stad? | 35 |
| 55 | Arnout van den Bosch - Raadslid PvdA Amstelveen | amstelveensnieuwsblad.nl | 40 |
| 56 | International Literature Festival Utrecht - ILFU | guts.events | 43 |
As we can see there are a lot of ads of politics, and all the websites are legit, this is one of the limitations of the Facebook Ads Library
The following example shows how a link is similar to the page name and therefore is having a distance closer to 0.
df_distances.head(5)
| page_name | link | levenshtein_distance | |
|---|---|---|---|
| 0 | Goednieuws.nl | goednieuws.nl | 1 |
| 1 | Nationaalhypotheekplan.nl | nationaalhypotheekplan.nl | 1 |
| 2 | Pineapple-smoothie | pineapple-smoothie.nl | 4 |
| 3 | Hivos | hivos.nl | 4 |
| 4 | D66 | d66.nl | 4 |
Checking the number of ads by advertiser to find odd patterns
Who is actually the website that is putting more ads on Facebook?
To answer this, we simply make a count of unique ads by each one of the pages, normally, certain campaigns of the same party run in parallel.
# ploting library
import plotly.express as px
# Aggregation and counting
df_ads_count = df_ads\
    .groupby('page_name')\
    .count()['ad_id']\
    .reset_index()\
    .sort_values(by='ad_id',ascending=False)\
    .rename(columns={'ad_id':'Ads Count', 'page_name':'Advertiser'})\
    .head(20)
px.bar(df_ads_count.sort_values(by='Ads Count',ascending=True),
       x='Ads Count', y='Advertiser', labels=None,
       orientation='h', color='Ads Count', color_continuous_scale='blues',title='Number of Ads by Advertiser')
Only Nationaal hypotheek plan is a website that is directly related to credit housing
Auditing the Demographic Groups Distribution
The Facebook Ads Library does not include any information of the actual people that were exposed to the ads, this would actually mean a violation of people's personal information and therefore a legal problem for Facebook. Instead, the API provides aggregated statistics of the demographics groups that were displayed by each ad.
For example, the ad number 752867881939190 was displayed with the following distribution.

We could therefore ask different questions such as. Which groups are longer exposed?
# Maximum exposure time of advertisement per group
df_demographics = \
    df_demographics\
    .merge(df_ads[['ad_id','ads_time','ads_days_time']], on='ad_id', how='left')

df_demographics\
    .groupby(['age','gender'])\
    .describe()['ads_time']\
    .reset_index()\
    .sort_values(by='mean',ascending=False)\
    .head(10)
| age | gender | count | mean | std | min | 25% | 50% | 75% | max | |
|---|---|---|---|---|---|---|---|---|---|---|
| 11 | 35-44 | unknown | 731 | 8 days 01:05:00.410396716 | 14 days 18:02:44.024106979 | 0 days 00:00:00 | 0 days 00:00:00 | 3 days 00:00:00 | 7 days 00:00:00 | 69 days 00:00:00 |
| 18 | 65+ | female | 731 | 8 days 01:05:00.410396716 | 14 days 18:02:44.024106979 | 0 days 00:00:00 | 0 days 00:00:00 | 3 days 00:00:00 | 7 days 00:00:00 | 69 days 00:00:00 |
| 16 | 55-64 | male | 731 | 8 days 01:05:00.410396716 | 14 days 18:02:44.024106979 | 0 days 00:00:00 | 0 days 00:00:00 | 3 days 00:00:00 | 7 days 00:00:00 | 69 days 00:00:00 |
| 15 | 55-64 | female | 731 | 8 days 01:05:00.410396716 | 14 days 18:02:44.024106979 | 0 days 00:00:00 | 0 days 00:00:00 | 3 days 00:00:00 | 7 days 00:00:00 | 69 days 00:00:00 |
| 14 | 45-54 | unknown | 731 | 8 days 01:05:00.410396716 | 14 days 18:02:44.024106979 | 0 days 00:00:00 | 0 days 00:00:00 | 3 days 00:00:00 | 7 days 00:00:00 | 69 days 00:00:00 |
| 13 | 45-54 | male | 731 | 8 days 01:05:00.410396716 | 14 days 18:02:44.024106979 | 0 days 00:00:00 | 0 days 00:00:00 | 3 days 00:00:00 | 7 days 00:00:00 | 69 days 00:00:00 |
| 12 | 45-54 | female | 731 | 8 days 01:05:00.410396716 | 14 days 18:02:44.024106979 | 0 days 00:00:00 | 0 days 00:00:00 | 3 days 00:00:00 | 7 days 00:00:00 | 69 days 00:00:00 |
| 19 | 65+ | male | 731 | 8 days 01:05:00.410396716 | 14 days 18:02:44.024106979 | 0 days 00:00:00 | 0 days 00:00:00 | 3 days 00:00:00 | 7 days 00:00:00 | 69 days 00:00:00 |
| 10 | 35-44 | male | 731 | 8 days 01:05:00.410396716 | 14 days 18:02:44.024106979 | 0 days 00:00:00 | 0 days 00:00:00 | 3 days 00:00:00 | 7 days 00:00:00 | 69 days 00:00:00 |
| 9 | 35-44 | female | 731 | 8 days 01:05:00.410396716 | 14 days 18:02:44.024106979 | 0 days 00:00:00 | 0 days 00:00:00 | 3 days 00:00:00 | 7 days 00:00:00 | 69 days 00:00:00 |
Distributions by Group
Moreover, we could explore which groups tend to be more microtargeted. Meaning that a campaign creator would only focus on a particular combination of demographical attributes. For instance "Female 18-24 group". The highest the percentage the more microtargeted.
# Creating a cross-table between gender and age groups per percentage of impresions
pivoted_demographics = df_demographics\
    .query("age != 'All (Automated App Ads)' & age != 'Unknown' & gender != 'All (Automated App Ads)' & percentage > 0.3")\
    .pivot_table(values='percentage', index=['gender','ad_id'], columns=['age'], aggfunc='max')\
    .reset_index()\
    .drop(columns=['ad_id'])

pivoted_demographics['gender_code'] = pivoted_demographics['gender']
pivoted_demographics\
    .gender_code\
    .update(pivoted_demographics.gender_code.map({'unknown':0,'male':1,'female':2}))
fig = px.parallel_coordinates(pivoted_demographics,
                             color="gender_code",
                              color_continuous_scale=[(0.00, "blue"),   (0.33, "blue"),
                                                     (0.33, "red"), (0.66, "red"), #male
                                                     (0.66, "teal"),  (1.00, "teal")]) #female

fig.update_layout(coloraxis_colorbar=dict(
    title="Percentage by Grpup",
    tickvals=[1,2,3],
    ticktext=["Male","Female","Unknown"],
#    lenmode="pixels", len=150,
))
fig.show()
From the ads we have we can see that male between 35 and 54 are more microtargeted than female, and it happens the opposite with young woman and woman 65+
px.scatter(df_demographics.query("age != 'All (Automated App Ads)' & age != 'Unknown' & gender != 'All (Automated App Ads)'"),
           x="age", y="ads_days_time", color="percentage", color_continuous_scale='RdBu',
           category_orders={"age": ["13-17", "18-24", "25-34", "35-44", "45-54", "55-64", "65+"]},
           labels=dict(age="Age Group", ads_days_time="Ads Impression in Days", percentage="Percentage"),
           size='percentage', hover_data=['gender'],title='Ads Exposure by Age Group')
Important to note that the group 18-24 is the age group were the ads are shown quicker and more microtargeted. (the blue color)
df_demographics[df_demographics['age']=='13-17']
| ad_id | age | gender | percentage | ads_time | ads_days_time | |
|---|---|---|---|---|---|---|
| 901 | 780097659346693 | 13-17 | female | 0.034416 | 2 days | 2.0 |
| 906 | 780097659346693 | 13-17 | male | 0.020521 | 2 days | 2.0 |
| 907 | 780097659346693 | 13-17 | unknown | 0.000322 | 2 days | 2.0 |
| 1969 | 2329971970554390 | 13-17 | female | 0.003751 | 1 days | 1.0 |
| 1973 | 2329971970554390 | 13-17 | male | 0.003301 | 1 days | 1.0 |
| 2294 | 280284460234974 | 13-17 | unknown | 0.000583 | 2 days | 2.0 |
| 2351 | 483771629518322 | 13-17 | unknown | 0.000436 | 2 days | 2.0 |
| 2384 | 786819222260001 | 13-17 | unknown | 0.001402 | 6 days | 6.0 |
| 2567 | 1939268466245038 | 13-17 | unknown | 0.000410 | 9 days | 9.0 |
| 2850 | 245501640441041 | 13-17 | unknown | 0.000108 | 7 days | 7.0 |
| 2862 | 2905246863087899 | 13-17 | unknown | 0.000140 | 7 days | 7.0 |
| 3026 | 899670257526493 | 13-17 | unknown | 0.000206 | 6 days | 6.0 |
| 3064 | 1054297118417663 | 13-17 | male | 0.000790 | 6 days | 6.0 |
| 3068 | 1054297118417663 | 13-17 | female | 0.000425 | 6 days | 6.0 |
| 4172 | 1147803325561535 | 13-17 | male | 0.036096 | 2 days | 2.0 |
| 4178 | 1147803325561535 | 13-17 | unknown | 0.002674 | 2 days | 2.0 |
| 4180 | 1147803325561535 | 13-17 | female | 0.050802 | 2 days | 2.0 |
| 8666 | 725835341410696 | 13-17 | unknown | 0.000135 | 3 days | 3.0 |
| 9629 | 372300827136015 | 13-17 | unknown | 0.000668 | 4 days | 4.0 |
| 9631 | 372300827136015 | 13-17 | male | 0.019372 | 4 days | 4.0 |
| 9632 | 372300827136015 | 13-17 | female | 0.068136 | 4 days | 4.0 |
| 13054 | 576577029917308 | 13-17 | male | 0.015323 | 3 days | 3.0 |
| 13055 | 576577029917308 | 13-17 | female | 0.025666 | 3 days | 3.0 |
| 13068 | 576577029917308 | 13-17 | unknown | 0.000192 | 3 days | 3.0 |
| 13263 | 2405199376398126 | 13-17 | male | 0.007215 | 1 days | 1.0 |
| 13266 | 2405199376398126 | 13-17 | female | 0.004329 | 1 days | 1.0 |
No matter the age group, normally the campaigns would run proportionally, the youngest group 13-17 still received some ads. The explanation for those cases is that the advertiser did not specify the age range to show the ad

Microtargeted Ads
Given the above observations, we could explore further the more clever marketing tricks, this microtargeting that can reach audiences in the most optimal way, like for instance targeting one specific demographic group. To gather those we get only the ads are only displayed by region, gender and age quickly exhausting the budget (the shortest amount of time).
ads_one_group = df_demographics\
    .query("age !='All (Automated App Ads)' and percentage > 0.5" )\
    .dropna()\
    .sort_values('ads_days_time', ascending = True)
ads_one_group.head(20)
| ad_id | age | gender | percentage | ads_time | ads_days_time | |
|---|---|---|---|---|---|---|
| 4223 | 3327051823976757 | 18-24 | male | 0.670185 | 0 days | 0.0 |
| 4004 | 845655732843719 | 65+ | female | 0.544670 | 1 days | 1.0 |
| 13218 | 531953940763325 | 18-24 | female | 0.549029 | 2 days | 2.0 |
| 12964 | 2957875800926921 | 18-24 | female | 0.611262 | 2 days | 2.0 |
| 2741 | 1377575595930710 | 18-24 | female | 0.574468 | 3 days | 3.0 |
| 4421 | 525463248697745 | 45-54 | male | 0.623288 | 4 days | 4.0 |
| 1499 | 2490880981219559 | 65+ | female | 0.530462 | 5 days | 5.0 |
| 2715 | 267935188180973 | 18-24 | female | 0.793443 | 5 days | 5.0 |
| 2789 | 2933486683588187 | 18-24 | female | 0.559717 | 5 days | 5.0 |
| 2824 | 716219072400160 | 25-34 | female | 0.720214 | 5 days | 5.0 |
| 2807 | 4301660326529020 | 18-24 | female | 0.555978 | 6 days | 6.0 |
| 2707 | 1217795991973567 | 18-24 | female | 0.519329 | 6 days | 6.0 |
| 8802 | 462666754908664 | 18-24 | female | 0.606613 | 6 days | 6.0 |
| 2607 | 711019742908749 | 18-24 | male | 0.688340 | 9 days | 9.0 |
| 2571 | 1939268466245038 | 18-24 | male | 0.528256 | 9 days | 9.0 |
| 2938 | 285958646379412 | 25-34 | male | 0.574039 | 11 days | 11.0 |
| 3720 | 421209305683508 | 18-24 | female | 0.513734 | 15 days | 15.0 |
Top 3 ads that were specifically targeted to demographic groups in a quick period of time exhausting the budget reaching maximum audience.

Here the actual URLs to the archive:
Top ad by Region
Similarly to the demographic groups, one can aggregate the ads impressions by Dutch province.
#df_regions[df_regions['ad_id'] == 321114872792279].sort_values('percentage',ascending = False)
ads_one_region = df_regions\
    .query("region !='All (Automated App Ads)' & percentage > 0.8" )\
    .groupby('region')\
    .count()['ad_id']\
    .reset_index()\
    .sort_values('ad_id')\
    .merge(df_regions.groupby('region').count()['ad_id'].reset_index(), on='region', how='left')\
    .rename(columns={'ad_id_x':'Targeted Ads', 'ad_id_y':'Total Ads'})
ads_one_region['Relative %'] =  ads_one_region['Targeted Ads']/ads_one_region['Total Ads']*100
ads_one_region.head(10)
| region | Targeted Ads | Total Ads | Relative % | |
|---|---|---|---|---|
| 0 | Paramaribo District | 3 | 3 | 100.000000 |
| 1 | Groningen | 4 | 507 | 0.788955 |
| 2 | Utrecht | 10 | 507 | 1.972387 |
| 3 | Flevoland | 11 | 507 | 2.169625 |
| 4 | Friesland | 11 | 507 | 2.169625 |
| 5 | Overijssel | 12 | 507 | 2.366864 |
| 6 | Drenthe | 14 | 340 | 4.117647 |
| 7 | Limburg | 15 | 507 | 2.958580 |
| 8 | Zeeland | 15 | 507 | 2.958580 |
| 9 | Gelderland | 16 | 507 | 3.155819 |
px.bar(ads_one_region, x='Relative %', y='region', labels=None,
       orientation='h', color='Targeted Ads', color_continuous_scale='blues',title='Most Microtargeted Regions')
df_regions[df_regions['region'] =='Paramaribo District']
| ad_id | region | percentage | |
|---|---|---|---|
| 666 | 351392375768110 | Paramaribo District | 0.908649 |
| 793 | 2300965023358112 | Paramaribo District | 0.853841 |
| 816 | 378689432774818 | Paramaribo District | 0.877164 |
The reading is that 4 out of 100 Ads shown in Noord-Brabant aren't shown anywhere else. On the other hand, 3 out of 3 ads that were shown in Paramaribo were specifically designed for that region, these correspond to 1 campaign.

Ads Topics
Performing N-grams analysis on the text of the ads. It is considered 1-grams to 4-grams terms using Dutch and English dictionaries, finally terms frequency and inverse terms frequency are compared.
import re
import nltk
from nltk.corpus import stopwords
from nltk.tokenize import word_tokenize
from sklearn.feature_extraction.text import CountVectorizer, TfidfVectorizer
# Taking into account only unique campaigns
ads_content = df_ads['ad_creative_body'].unique()
ads_content = [str(i).lower() for i in ads_content]
def clean_text_round(text):
'''Make text lowercase, remove text in square brackets, remove punctuation and remove words containing numbers.'''
text = text.lower()
text = re.sub('\[.*?\]', ' ', text)
text = re.sub('\w*\d\w*', ' ', text)
text = re.sub('<.*?>', ' ', text)
text = re.sub('\n', ' ', text)
text = re.sub('\t', ' ', text)
text = re.sub('\(b\)\(6\)', ' ', text)
text = re.sub('"', ' ', text)
text = re.sub('---', ' ', text)
return text
stop_words = set(stopwords.words(['english','dutch','turkish']))
your_list = ['stem','het','onze','we','mij','jou','nl','jouw','mee','wij', 'nl ',' ','jij','nan','per','word','nederland', 'kamer','partij','tweede','stemmen','den','gaat','https','daarom','cda','pvda','fvd','denk','oranje','vvd','groenlinks','sp','ga','www','code','verkiezingen','nummer']
for i, line in enumerate(ads_content):
    ads_content[i] = ' '.join([str(x).lower() for
        x in nltk.word_tokenize(line) if
        ( x not in stop_words ) and ( x not in your_list )])
# Getting n-grams table
def ngrams_table(n, list_texts):
    vectorizer = CountVectorizer(ngram_range = (n,n))
    X1 = vectorizer.fit_transform(list_texts)
    features = vectorizer.get_feature_names()
    # Applying TFIDF
    vectorizer = TfidfVectorizer(ngram_range = (n,n))
    X2 = vectorizer.fit_transform(list_texts)
    # Getting top ranking features
    sums1 = X1.sum(axis = 0)
    sums2 = X2.sum(axis = 0)
    data = []
    for col, term in enumerate(features):
        data.append( (term, sums1[0,col], sums2[0,col] ))

    return pd.DataFrame(data, columns = ['term','rankCount', 'rankTFIDF']).sort_values('rankCount', ascending = False).reset_index(drop=True)
ads_content = [clean_text_round(text) for text in ads_content]
table_ngrams = pd.DataFrame()
for i in [1,2,3,4]:
    table_ngrams = table_ngrams.append(ngrams_table(i, ads_content))
# drop weird first term
table_ngrams_plot = table_ngrams.iloc[1:,:]\
    .sort_values(by='rankCount')\
    .reset_index(drop=True)\
    .rename(columns={'rankCount':'Term Frequency', 'rankTFIDF':'Inverse Term Frequency', 'term':'N-grams Keywords'})\
    .sort_values('Inverse Term Frequency',ascending=False)
px.bar(table_ngrams_plot.head(40).sort_values(by='Inverse Term Frequency', ascending=True),
       x='N-grams Keywords', y='Inverse Term Frequency', labels=None,
       orientation='v', color='Term Frequency', color_continuous_scale='RdBu',title='Ads Terms Frecuency')
The n-grams analysis does not necessarily present key insights, mostly we can see generic terms, what would be interesting to analyse is the consistency of the advertisement and the actual campaign plans. Not only that, but this workflows can be adapted to be iterable so that we could see what topics are shown by demographic groups and regions.
Related work and Conclusion
There is also some interesting work conducting similar analysis, for example, Sara Kingsley et al. paper Auditing Digital Platforms for Discrimination in Economic Opportunity Advertising, shows how we systematically collect ads and find discrimination based on the demographics or locations, for US data it was possible in 2020 to gather ads tagged as, Credit, Housing, and Employment.
Also, Muhammad Ali et al. paper Discrimination through optimization: How Facebook’s ad delivery can lead to skewed outcomes explore the concept of skewness in the ad delivery process, where the background of the advertiser when designing parameter for campaigns can lead to discrimination when is only focused on optimizing impressions and budget.
In this notebook, we have focused on the Dutch credit housing finding not surprising insights, however, what is more, important is to open the discussion whether Facebook should be forced to open their Ads Library to access all types of ads and not only the "Social Issues, Elections or Politics" category.